For years, headlines have claimed that Europe—Germany in particular—would “pivot” toward China and away from the United States because that is where the money and growth supposedly are. A look at the hard numbers tells a very different story.
Trade: headline volumes vs. real dependency
While the media like to emphasise China is Germany’s top single import source, the margin is slender. In 2024 German firms bought €156 bn worth of goods from China (11.9% of total imports), versus €91 bn from the United States (7.0 %). What the media and observers frequently miss is that most of those “Chinese” shipments sit on Western foundations. Foreign-invested enterprises (FIEs) still generate roughly one-third of China’s total trade—a point Beijing itself has emphasised.
What really matters to German factories is value-added, not gross flows. OECD input–output tables show that only about 3% of the value added embodied in German final demand actually originates in China; the figure for the United States is higher, even though its gross-import share is lower.
As such, the import number that grabs the headline overstates how much “China” is really in German products, and understates the U.S. contribution.
Investment: following the money
If we look into the financial links, particularly the foreign direct investment (FDI), China is nowhere to compete with the US:
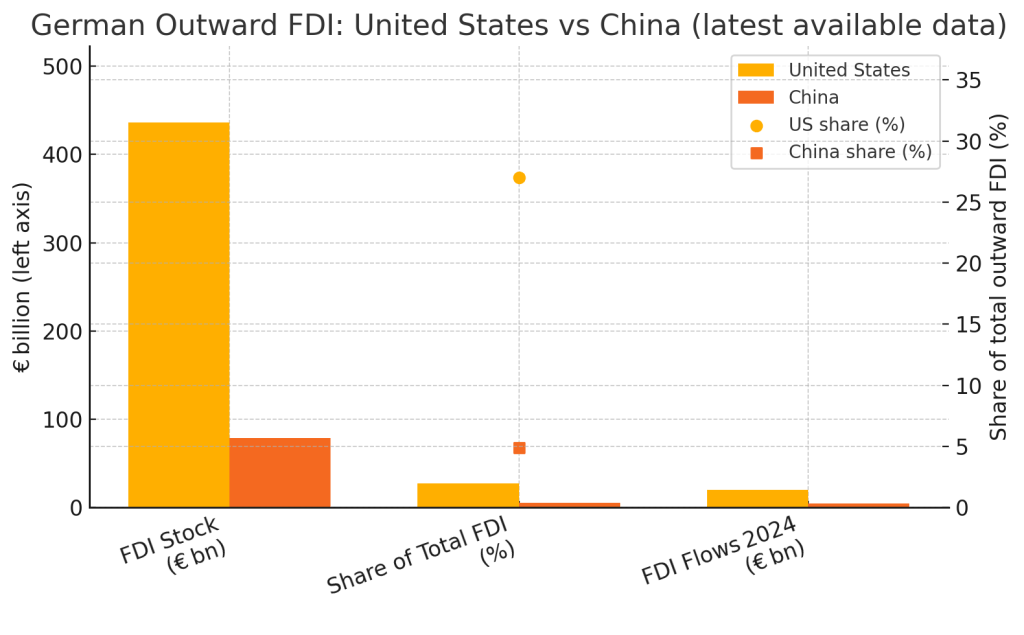
FDI stock (end-2023) – the United States hosts €436 bn of German equity, versus €79 bn in China. That is 5½ × more and represents 27 % of Germany’s total outward stock, while China is below 5 %.
Share of total outward FDI – calculated from the same Bundesbank stock figures: US 27% vs China ≈ 4.9%.
New outward FDI flows in 2024 – German companies ploughed almost €20 bn into the US last year, against €4.4 bn into China (equity principle, Bundesbank “Transaction values” table).
Technology pipelines: irreplaceable U.S. inputs
From a pure statistical standpoint, is Germany’s largest industrial supply source:
- Intermediate industrial inputs (OECD TiVA) – China 10% vs. U.S. 5%
- Gross goods imports (Destatis) – China 12% vs. U.S. 7%
However, very few analysts have ever dug further than superficial statistics:
- Scale vs. Control – China moves more tonnage into Germany, but ~28.5 % of China’s exports are shipped by foreign-invested enterprises (FIEs) that use Western designs and tooling. In cars, for instance, Tesla’s Shanghai plant alone made ~10 % of all PRC vehicle exports last year. In other words, much of “China’s” supply is really Western know-how offshored for cost.
- Technology depth – The inputs Germany simply cannot source elsewhere – cutting-edge chips, semiconductor tools, specialised pharma intermediates, GAIA-X-certified cloud, high-end avionics, advanced software stacks – are U.S.-dominated. Example: the U.S. supplied €12.2 bn of Germany’s pharmaceutical imports in 2023 (16.4 % of the total), dwarfing China’s low-single-digit share. As for cloud infrastructure, the U.S. hyperscalers AWS, Azure and Google Cloud control 63% of the world market, while all Chinese providers together sit well below 10% (Canalys Q2-2024).
- Systemic leverage – U.S. export-control regimes on AI chips or cloud services would hit German industry immediately; few realistic substitutes exist. By contrast, if China tried to weaponise exports, a significant slice of what it would be “withholding” are goods produced in plants owned, tooled and programmed by Western multinationals – making coercion far costlier for Beijing than for Washington.
Modern German industry—automotive software stacks, generative-AI development, semiconductor design, secure cloud hosting—runs on U.S. platforms that Beijing currently cannot replicate or replace.
Myth busted
- Trade volumes alone mislead. Once you strip out Western value added embedded in China’s export machine, Germany’s real dependence on Chinese inputs is modest.
- Capital chooses the United States. German outward FDI keeps piling up in America because that is where the critical technologies, deep consumer market and legal certainty reside.
- Technological choke-points are American. Whether in cloud, semiconductors or advanced manufacturing software, U.S. suppliers remain mission-critical for German firms; Chinese alternatives do not yet come close.
Germany’s pattern is not an outlier—it is symptomatic of wider European realities. Far from preparing to “ditch” the United States, Europe’s largest economy is still structurally wired into the trans-Atlantic ecosystem. The real risk for Berlin is not over-reliance on Washington, but over-interpreting gross trade tables and underestimating how deeply its prosperity is tied to U.S. capital and technology.
So next time you read that Europe is drifting inexorably toward Beijing, remember the numbers—and the charts—above. The data shows a sturdier Atlantic bridge than the headlines suggest.
References
- Deutsche Bundesbank. (2025, April 30). Direct investment stock statistics: Germany’s outward and inward FDI positions (end-2023). Retrieved from: https://www.bundesbank.de
- Deutsche Bundesbank. (2025, May 27). Direct investment by country — Transaction values (2024). Retrieved from: https://www.bundesbank.de
- Destatis — German Federal Statistical Office. (2024, February). Foreign trade — Ranking of Germany’s trading partners 2023. Retrieved from: https://www.destatis.de
- OECD Trade in Value Added (TiVA) database. (2023 edition). Value-added and foreign content in exports and imports — Germany. Retrieved from: https://www.oecd.org/industry/ind/measuring-trade-in-value-added.htm
- German Economic Institute (IW Köln). (2024). Investitionen in China: Deutsche Abhängigkeit differenziert betrachten. Retrieved from: https://www.iwkoeln.de
- Canalys. (2024, Q4). Global cloud infrastructure market share — AWS, Azure, Google Cloud, Alibaba. Retrieved from: https://www.canalys.com
- Statistisches Bundesamt (Destatis). (2024, March). Pharmaceutical imports by origin country — Germany 2023. Retrieved from: https://www-genesis.destatis.de
- Ministry of Commerce of the People’s Republic of China (MOFCOM). (2024). Foreign-invested enterprise (FIE) trade data 2023. Retrieved from: http://english.mofcom.gov.cn
- Tesla Inc. — Investor Relations. (2024, Q4). Gigafactory Shanghai export figures. Retrieved from: https://ir.tesla.com
- OECD iLibrary. (2024). Input-output tables and intermediate input shares in production — Germany, 2019. Retrieved from: https://www.oecd-ilibrary.org

Leave a comment